PL-300 Exam Dumps - Microsoft Power BI Data Analyst
You need to create a visual as shown in the following exhibit.
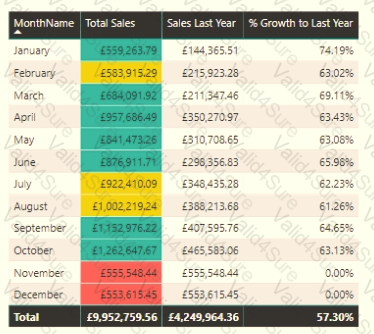
The indicator color for Total Sales will be based on % Growth to Last Year.
The solution must use the existing calculations only.
How should you configure the visual? To answer, select the appropriate options in the answer area.
NOTE: Each correct selection is worth one point.

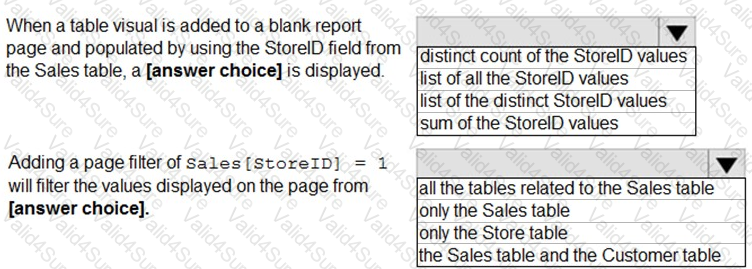
You have the Power BI data model shown in the following exhibit.
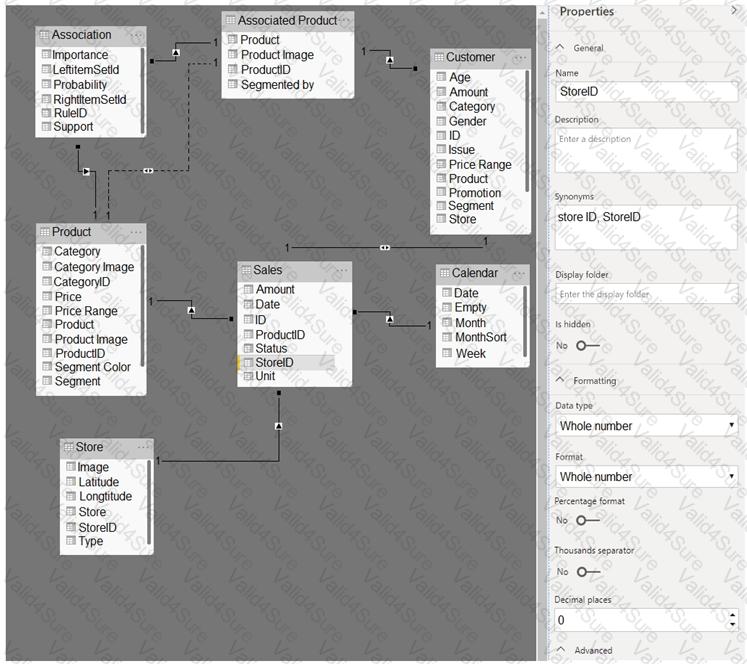
Use the drop-down menus to select the answer choice that completes each statement based on the information presented in the graphic.
NOTE: Each correct selection is worth one point.
You plan to use Power BI Desktop optimized for Power BI Report Server to create a report. The report will be published to Power BI Report Server.
You need to ensure that all the visualization in the report can be consumed by users.
Which two types of visualizations should you exclude from the report? Each correct answer presents part of the solution.
NOTE: Each correct selection is worth one point.
You have a Rawer Bl report That imports a dace table and a sales table from an Azure SQL database data source. The sales table has the following date foreign keys:
• Due Date
• Order Date
• Delivery Date
You need to support the analysis of sales over time based on all three dates at the same time.
Solution: From the Fields pane, you rename the date table as Due Date. You use a DAX expression to create Order Date and Delivery Date as calculated tables. You create active relationships between the sales table and each date table.
Does this meet the goal?
You need to create a Power Bl theme that will be used in multiple reports. The theme will include corporate branding for font size, color, and bar chart
formatting.
What should you do?
You are creating a line chart in a Power Bl report as shown in the following exhibit.
Use the drop-down menus to select the answer choice that completes each statement based on the information presented in the graphic.
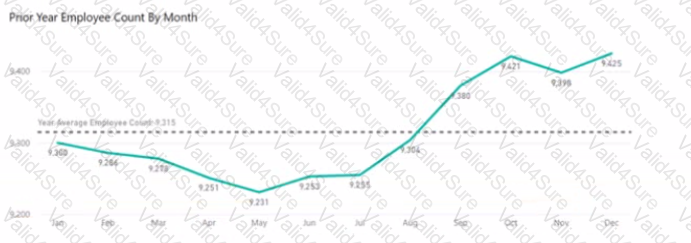
NOTE: Each correct selection is worth one point.

-
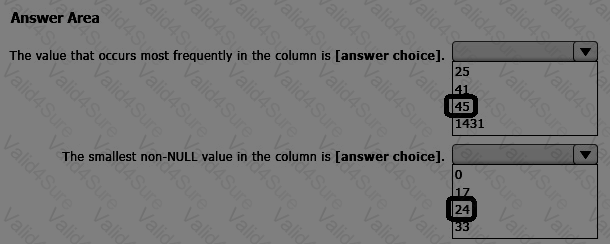
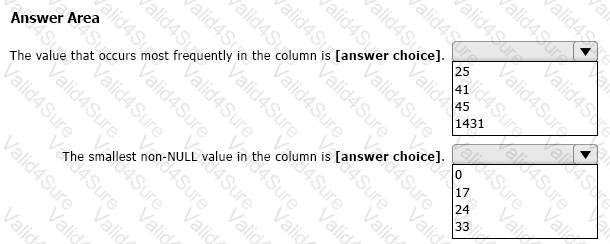
You are using Power Query Editor to preview the data in a column named Max Temp. The column statistics and value distribution are shown in the following exhibit.
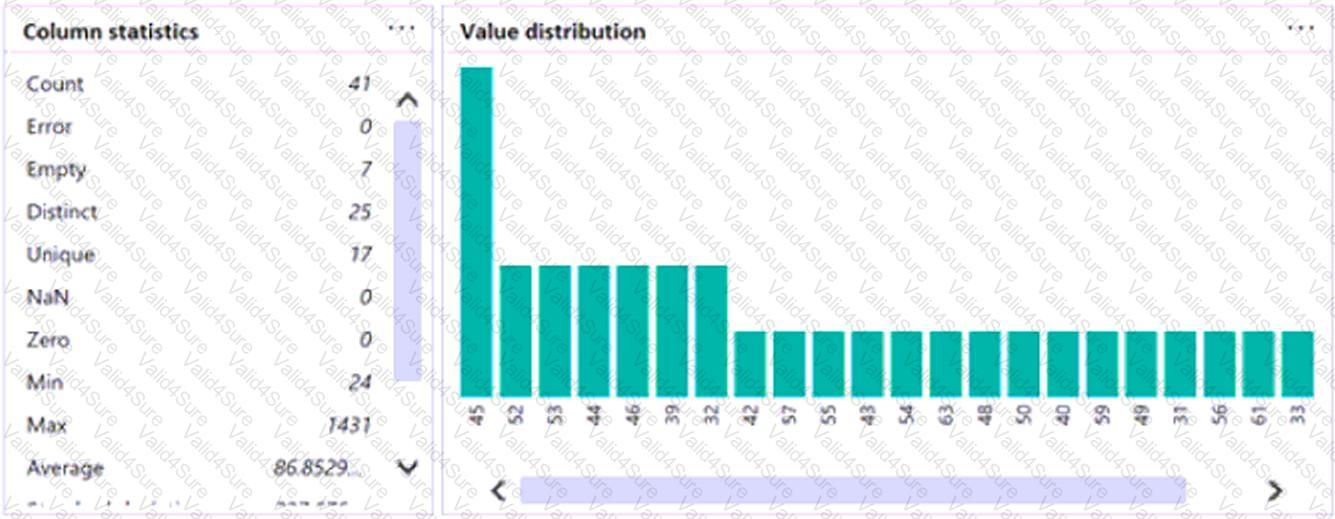
Use the drop-down menus to select the answer choice that completes each statement based on the information presented in the graphic.
NOTE: Each correct selection is worth one point.
You have a report in Power Bl named report1 that is based on a shared dataset.
You need to minimize the risk of data exfiltration for report1. The solution must prevent other reports from being affected.
What should you do?

